Grappling With Climate Change Data to Understand Mathematical Concepts
Students compare graphical interpretations of carbon dioxide and temperature correlation providing context for mathematical concepts.
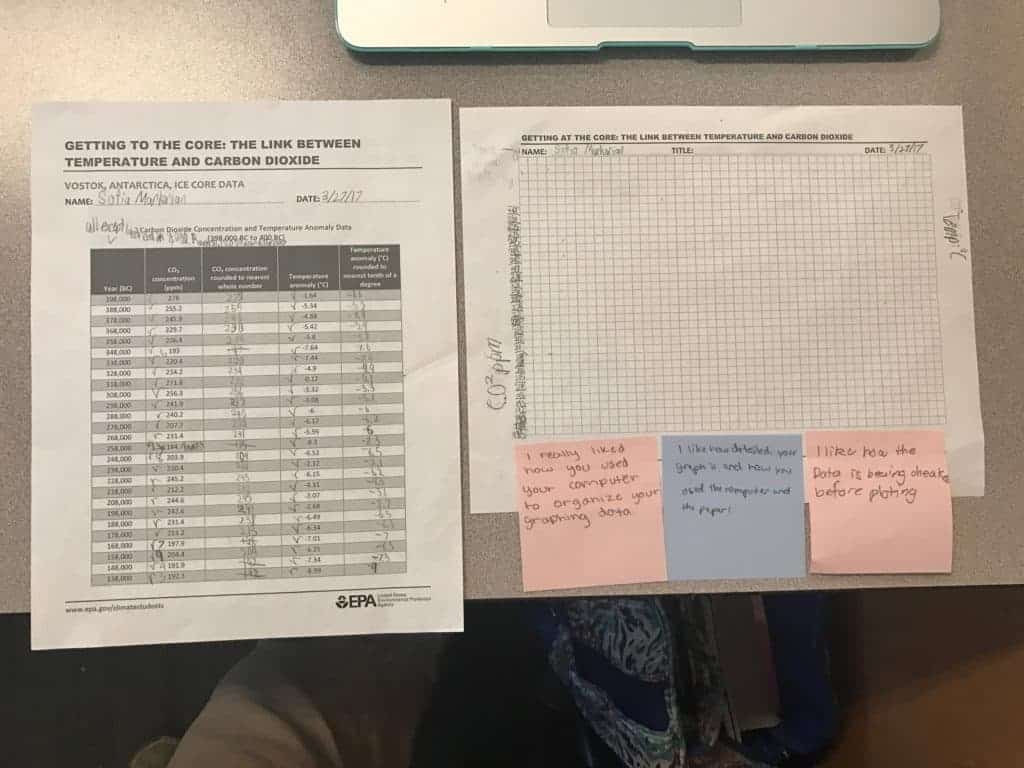
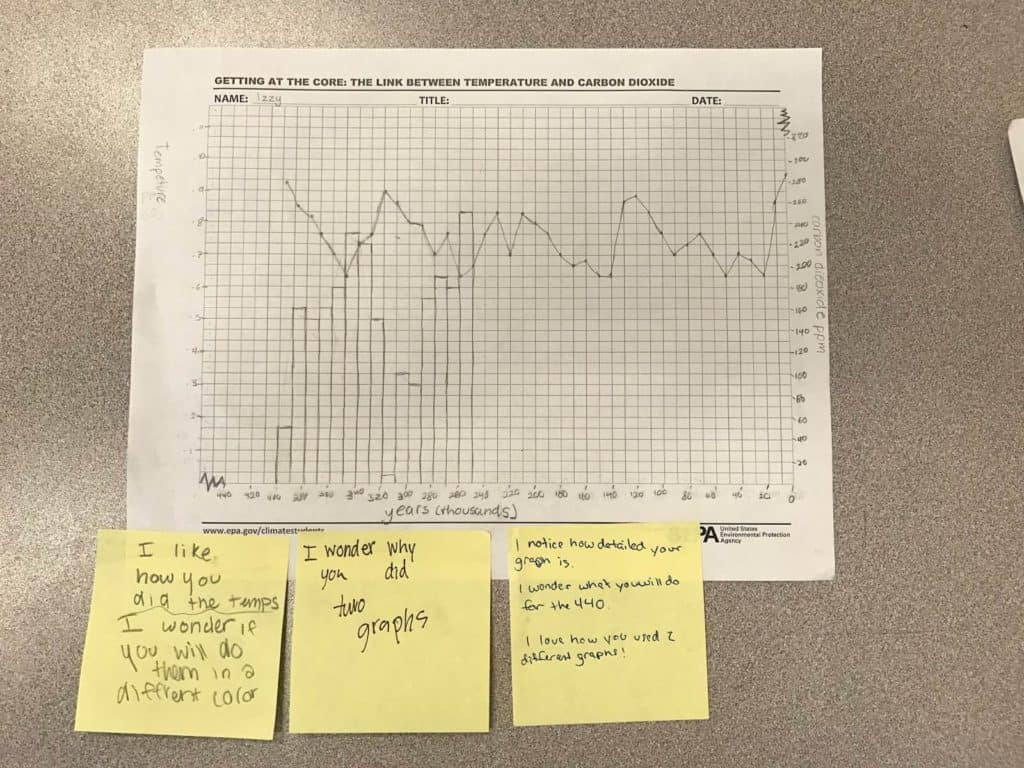
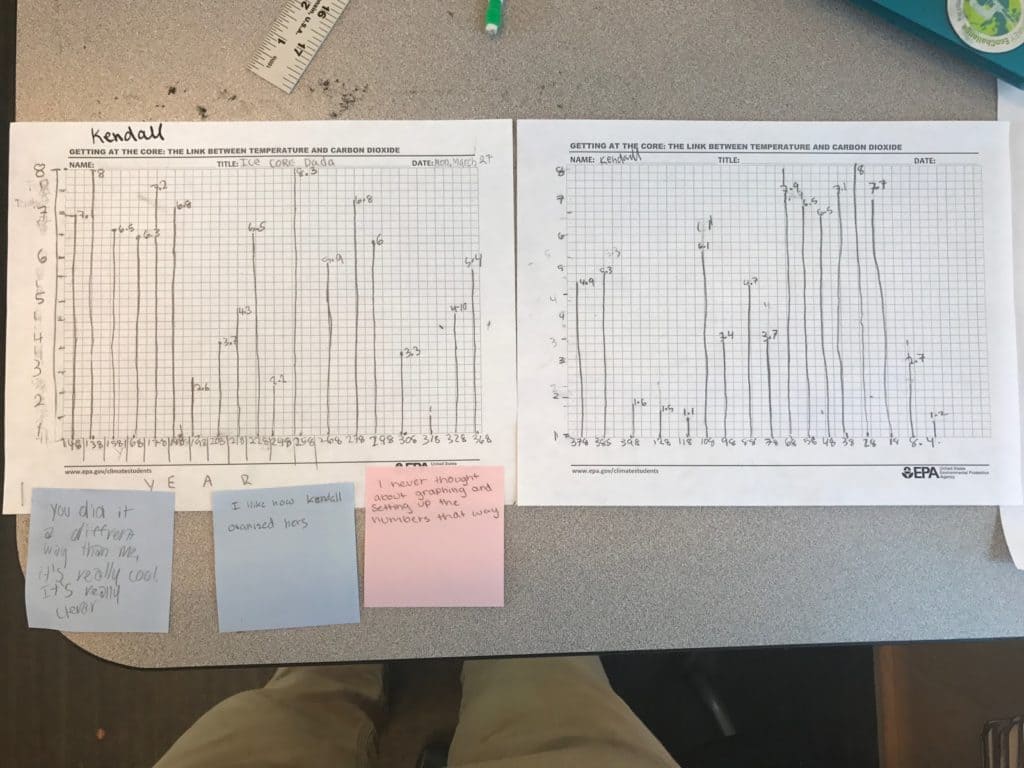
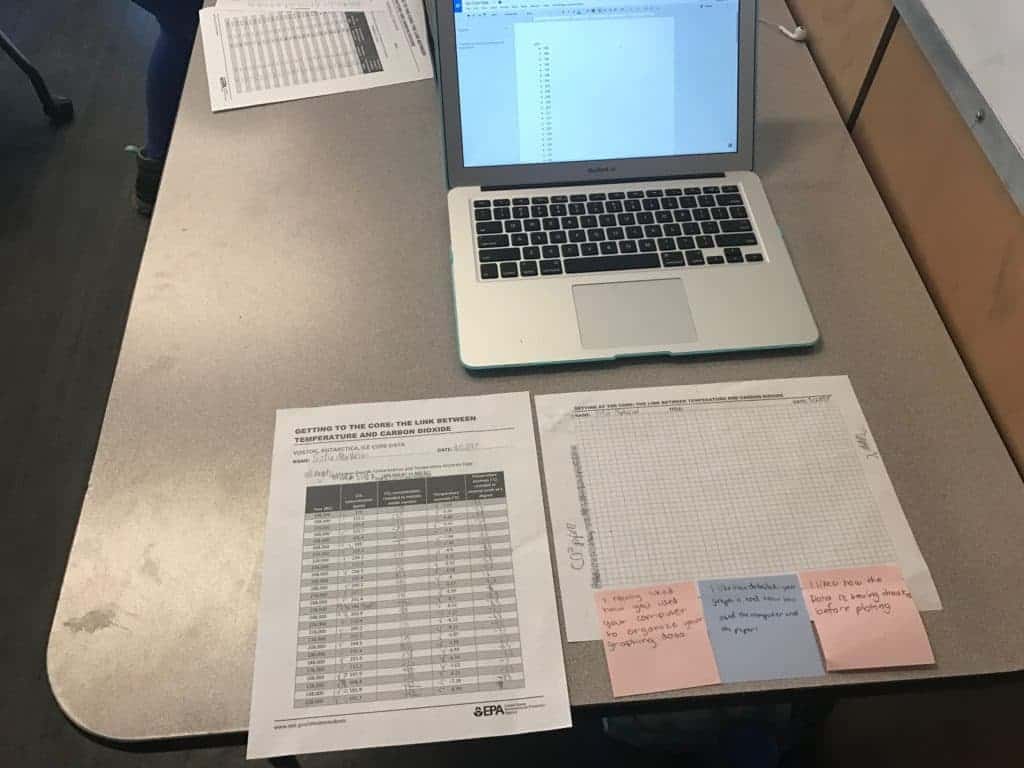
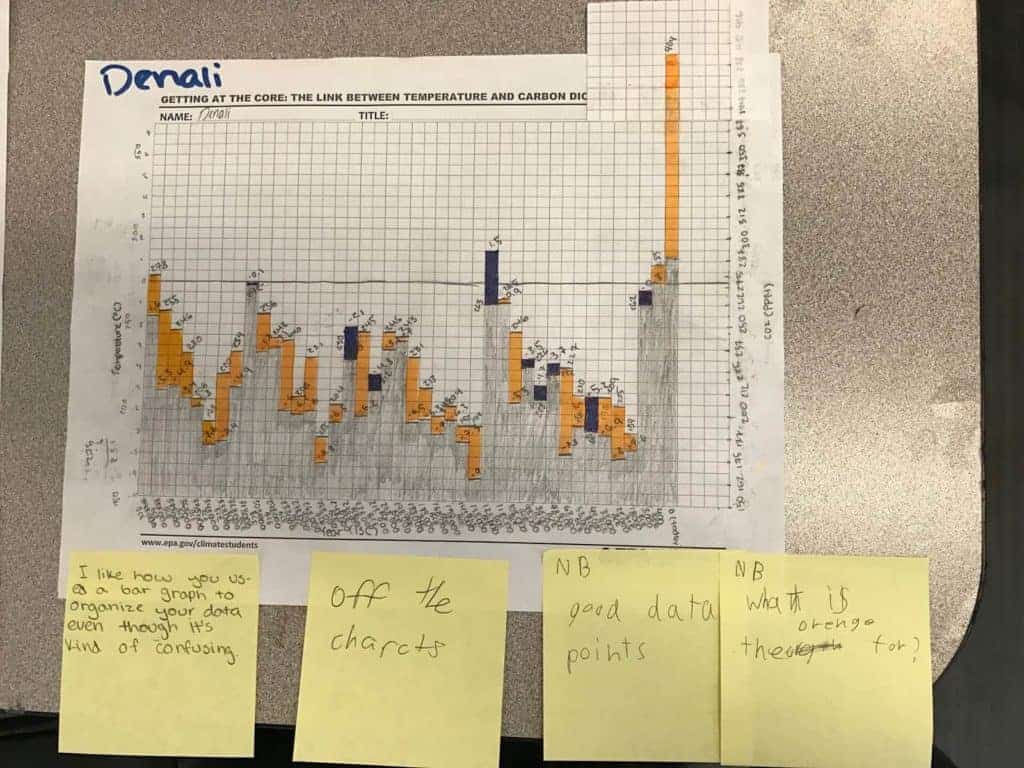
Integrating real-world expedition related math problems creates a context for mathematical concepts. Middle school students at TEA are regularly presented with math problems and grapples that tie mathematical concepts to expedition related content. Seventh graders studying climate change are tasked with a math grapple involving graphing and interpreting carbon dioxide and temperature data. Using ice core data, students organize, graph, and analyze data in order to provide evidence for the claim that Earth’s climate is being anthropogenically altered via our emission of CO2.
The seventh-grade students work in an individually paced adaptive online mathematical program. This means that students are studying a spectrum of topics within the mathematical curriculum.
This math grapple is therefore designed to allow for differentiated entry points for mathematical concepts. At the same time, through a chalk talk protocol, students are allowed to receive feedback and learn by observation from each other and the teacher.
Students begin by organizing data and graphing data sets. In order to graph their data, they are required to find the range of inputs in order to label their axes. They then are asked to compare and interpret the data and give a conclusion with the reasoning for their choice. Math grapples such as this benefits students in multiple ways. They not only allow students to create concrete schema connecting mathematical concepts to real world concepts but also reinforce understanding of expedition content that often shows up in final product work.
View Student Work